Fireworks
Animating fireworks with ggplot2 and gganimate
Since Thomas Lin Pedersen took over gganimate, I’ve been building animations. Mostly what I’ve built is not for any particular data visualization purpose. My motivations vary, but have included
- I want to try out new features of the package
- I’m bored
- I’m trying to understand trig functions in polar space
- I have an idea
- I can’t focus
- I want to play with matrix transformations
- I want to make pretty things
…but I mostly make them because they make me happy. The results could be charitably called generative art, though they’re more a pale homage to artists deserving of the title like @beesandbombs.
Today I went back to an old idea stemming from some work with spatial grids in sf. Plotting the grids with a projection, I discovered that when covering the whole globe, projected grids sometimes look like fireworks, e.g.
library(tidyverse)
library(sf)
theme_set(hrbrthemes::theme_ipsum_ps())

grid_plot <- expand.grid(lon = seq(-180, 180, 10),
                         lat = seq(-90, 90, 10)) %>%
    pmap(~st_point(c(...))) %>%    # convert each pair to an sf point
    st_sfc(crs = 4326) %>%    # convert all points to sf column
    st_sf() %>%    # convert to sf data frame
    ggplot() +
    geom_sf()

grid_plot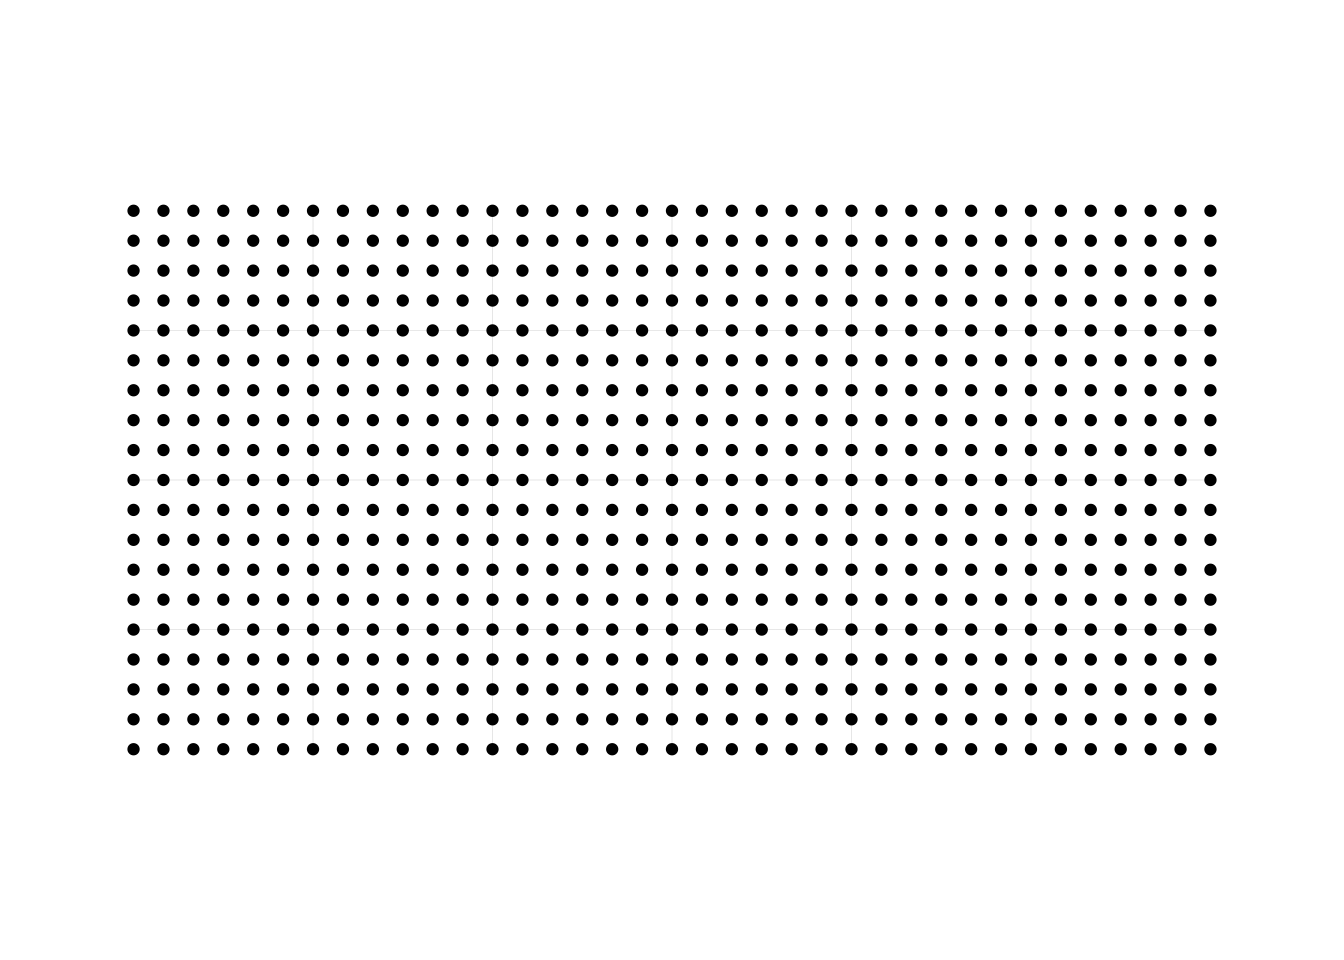
grid_plot + coord_sf(crs = "+proj=laea +lat_0=-90 +ellps=WGS84 +no_defs")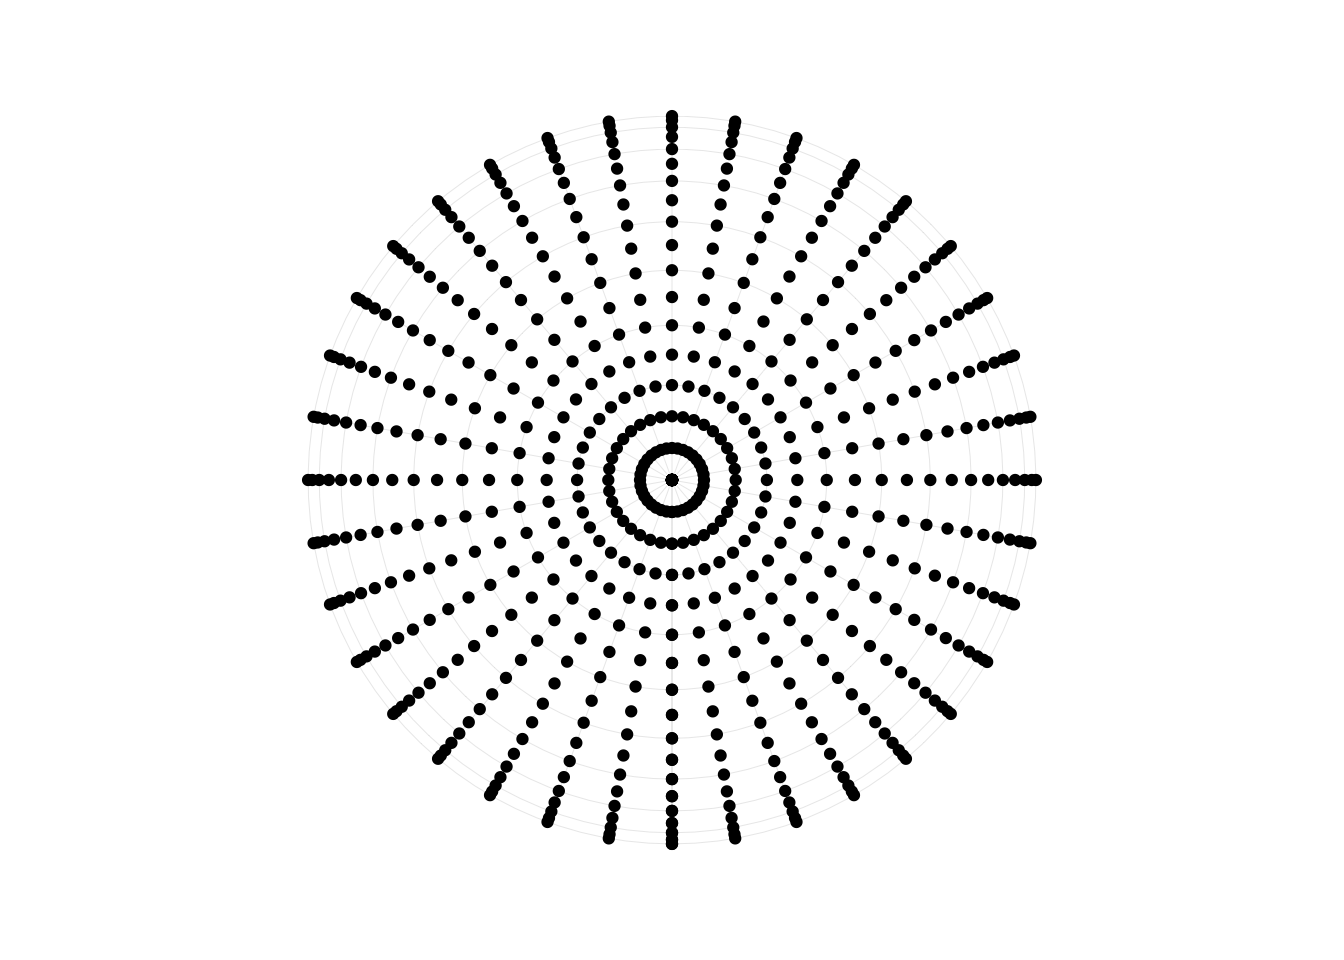
Grids as fireworks sounded like a prime candidate for animation, which I finally got back to today. Instead of using sf, I stuck to polar coordinates, which can produce a similar effect with less effort.
Most of my plots were not what I wanted. Some didn’t move. Some moved too slow, or with the wrong acceleration. Some were just expanding rings. But here I present some of my more interesting failures, together with a couple results that could be convincingly called fireworks.
A hole
Exponential decay doesn’t slow down, it goes backwards:
library(gganimate)
theme_set(theme_void() + theme(
    panel.background = element_rect(fill = 'black')
))
p <- crossing(x = 1:30, nesting(t = 1:10, y = .5^(seq(t)))) %>%
ggplot(aes(x, y)) +
geom_point(color = 'white') +
coord_polar() +
transition_time(t) +
shadow_wake(0.5)
animate(p, fps = 30)
Straight
p <- map_dfr(1:10, ~crossing(x = 1:30, nesting(
        y = seq(1, .x, length.out = 10)^0.5,
        t = 1:10
    ))) %>%
    ggplot(aes(x, y)) +
    geom_point(color = 'white') +
    coord_polar() +
    transition_time(t) +
    shadow_wake(0.3)

animate(p, fps = 30)
I thought this was what I wanted, but seeing it, while it may be how we think fireworks look (a bunch of points shot out at equally-spaced intervals on a circle), it doesn’t actually look right, because fireworks aren’t circles, they’re spheres.
Particles and gnats
I couldn’t figure out the spacing, so I tried random uniform numbers instead of a sequence:
p <- map_dfr(1:10, ~data_frame(y = seq(1, .x, length.out = 10), t = 1:10)) %>%
    mutate(x = runif(n())) %>%
    ggplot(aes(x, y)) +
    geom_point(color = 'white') +
    coord_polar() +
    transition_time(t) +
    shadow_wake(0.5)

animate(p, nframes = 300, fps = 30)
…which returned a bunch of weird particles, or with shorter timing
animate(p, nframes = 30)
..gnat-swarm fireworks. Which are fireworks, but not the type I wanted.
Mandala
I don’t know what happened here, but it’s trippy.
p <- map_dfr(1:10, ~crossing(
        x = 1:30,
        nesting(
            y = runif(10),
            t = 1:10
        )
    )) %>%
    ggplot(aes(x, y)) +
    geom_point(color = 'white') +
    coord_polar() +
    transition_time(t) +
    shadow_wake(0.5)

animate(p, nframes = 20)
Explosion
Ok, this is what I meant, but it just looks like an explosion.
p <- map_dfr(1:10, ~crossing(
        x = runif(30),
        nesting(
            y = seq(1, .x, length.out = 10)^0.5,
            t = 1:10)
        )
    ) %>%
    ggplot(aes(x, y)) +
    geom_point(color = 'white') +
    coord_polar() +
    transition_time(t) +
    shadow_wake(0.5)

animate(p, fps = 30)
Spirals
Getting pretty close.
p <- map_dfr(1:10, ~crossing(
        x = {
            x = seq(30) + 0.3*.x;
            ifelse(x > 30, x - 30, x)
        },
        nesting(
            y = seq(1, .x, length.out = 10)^0.5,
            t = 1:10)
        )
    ) %>%
    ggplot(aes(x, y)) +
    geom_point(color = 'white') +
    coord_polar() +
    transition_time(t) +
    shadow_wake(0.3)

animate(p, fps = 30)
In-n-out
Wait what happened here
p <- map_dfr(0:10, ~crossing(
        x = {
            x = seq(30) + 0.6*.x;
            ifelse(x >= 30, x - 30, x)
        },
        nesting(
            y = seq(1, .x, length.out = 10)^0.5,
            t = 1:10)
        )
    ) %>%
    ggplot(aes(x, y)) +
    geom_point(color = 'white') +
    coord_polar() +
    transition_time(t) +
    shadow_wake(0.5)

animate(p, fps = 30)
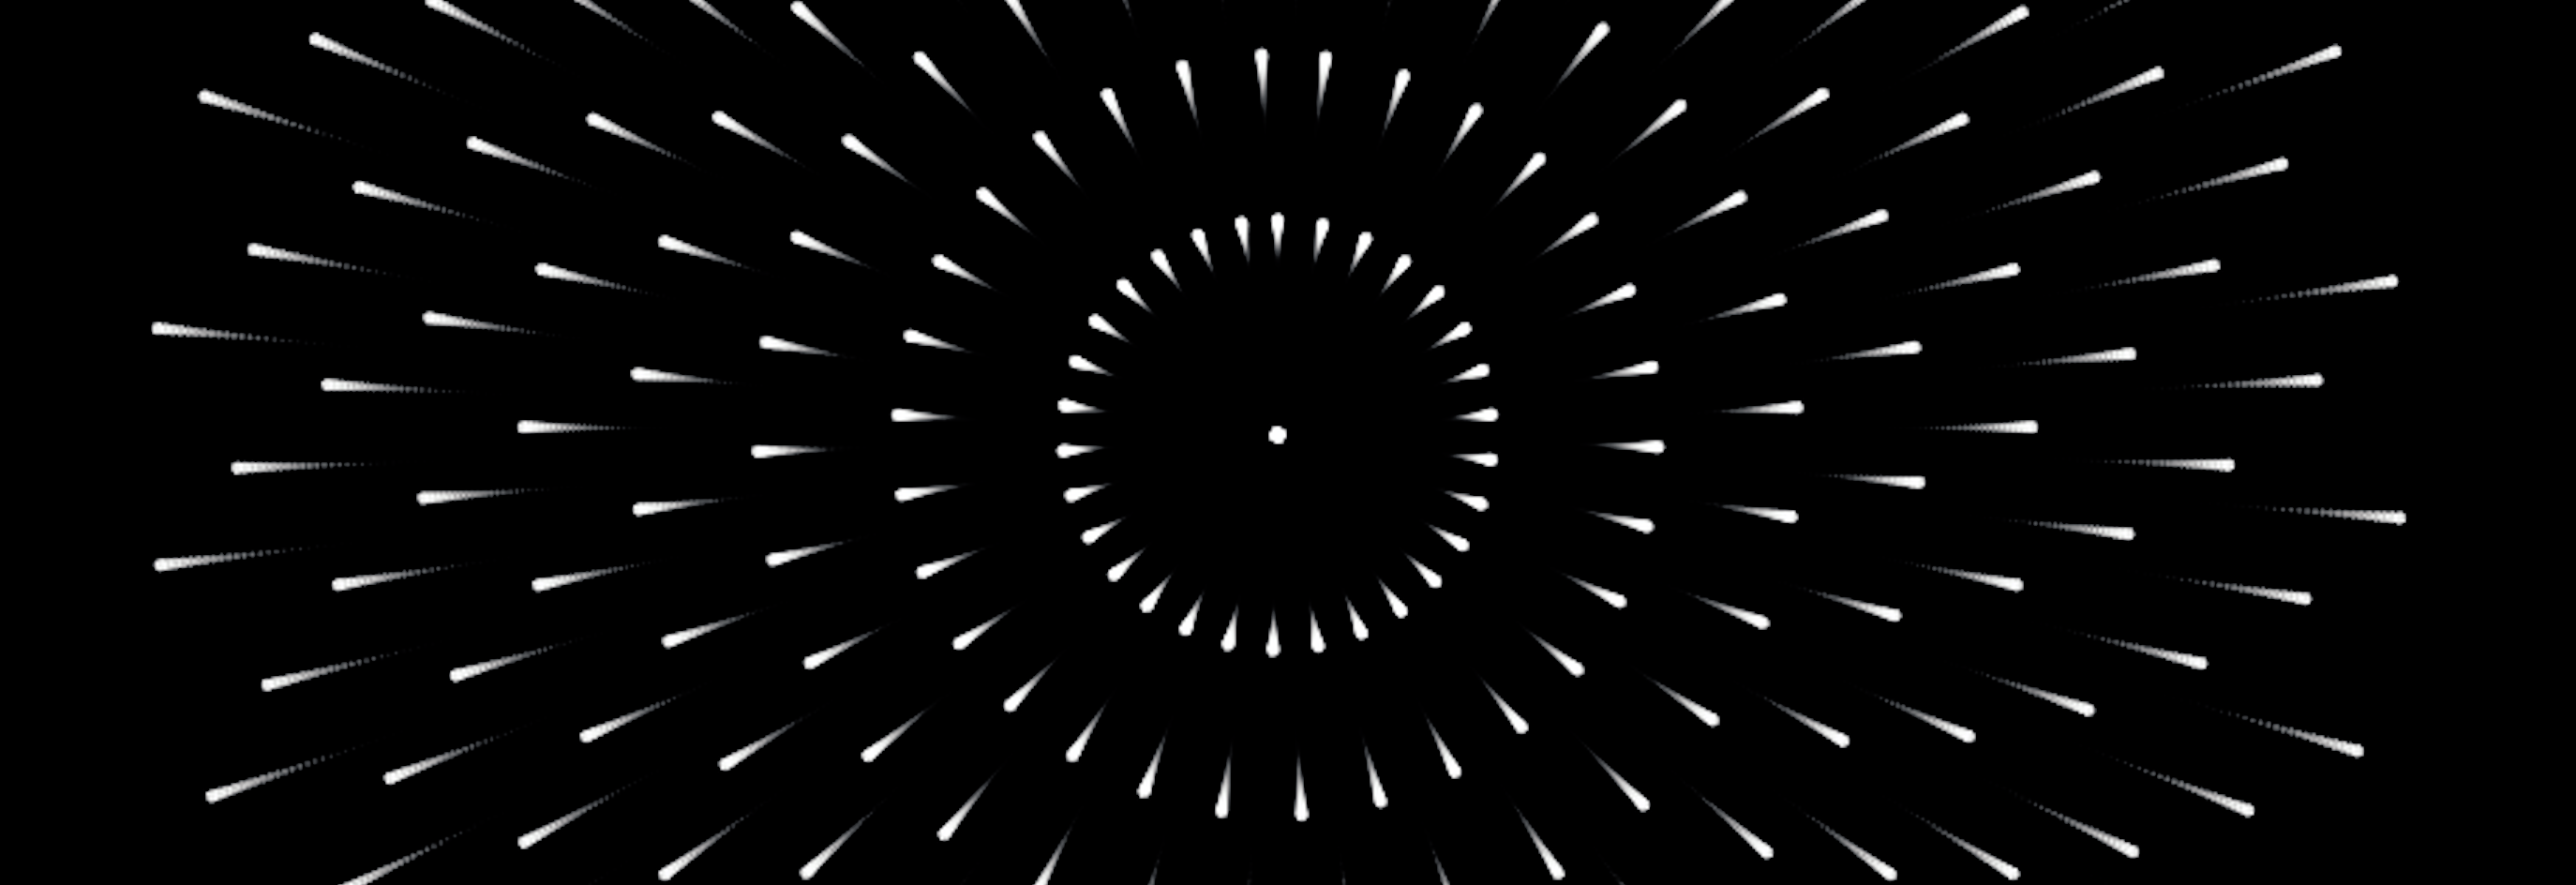
Firework
p <- map_dfr(1:10, ~crossing(
        x = {
            x = seq(30) + 0.6*.x;
            ifelse(x > 30, x - 30, x)
        },
        nesting(
            y = seq(1, .x, length.out = 10)^0.5,
            t = 1:10)
        )
    ) %>%
    ggplot(aes(x, y)) +
    geom_point(color = 'white') +
    coord_polar() +
    transition_time(t) +
    shadow_wake(0.3)

animate(p, fps = 30)
Yep, that’s definitely a firework. Done.

Share this post